The Semrush Traffic & Market Toolkit is your complete market and competitor analysis solution.
The toolkit includes a set of specialized dashboards offering data that can help you:
- Monitor competitor traffic across all digital channels, including AI traffic
- Explain traffic spikes and drops with Traffic Insights
- Benchmark your performance against rivals
- Automate tracking of competitor updates and shifts
Getting started with the Traffic & Market Toolkit is simple. We’ll guide you through the dashboards and show you how to start analyzing traffic, researching markets, and building smarter strategies — backed by real-world data.
Step 1: Get started by entering domains and creating a list
The Get Started menu is your entry point into the Semrush Traffic & Market Toolkit. It’s designed to help you quickly add domains and move into your analysis.

You’ll use this page to kick off a full analysis workflow - from benchmarking your competitors to spotting growth opportunities and traffic gaps. It’s your launchpad into the entire Traffic & Market experience.
At the top of the menu, you’ll see a search panel where you can:
- Enter the main domain you would like to analyze
- Click + Add competitors to compare multiple sites at once
- Click Analyze to pull up dashboards with data and charts, starting with the Traffic Analytics dashboard
The domains you entered are saved in Lists and you can access them anytime.
You’ll see your saved lists shown on the Get Started screen. Click any one of them to jump straight into your dashboards and pick up right where you left off.
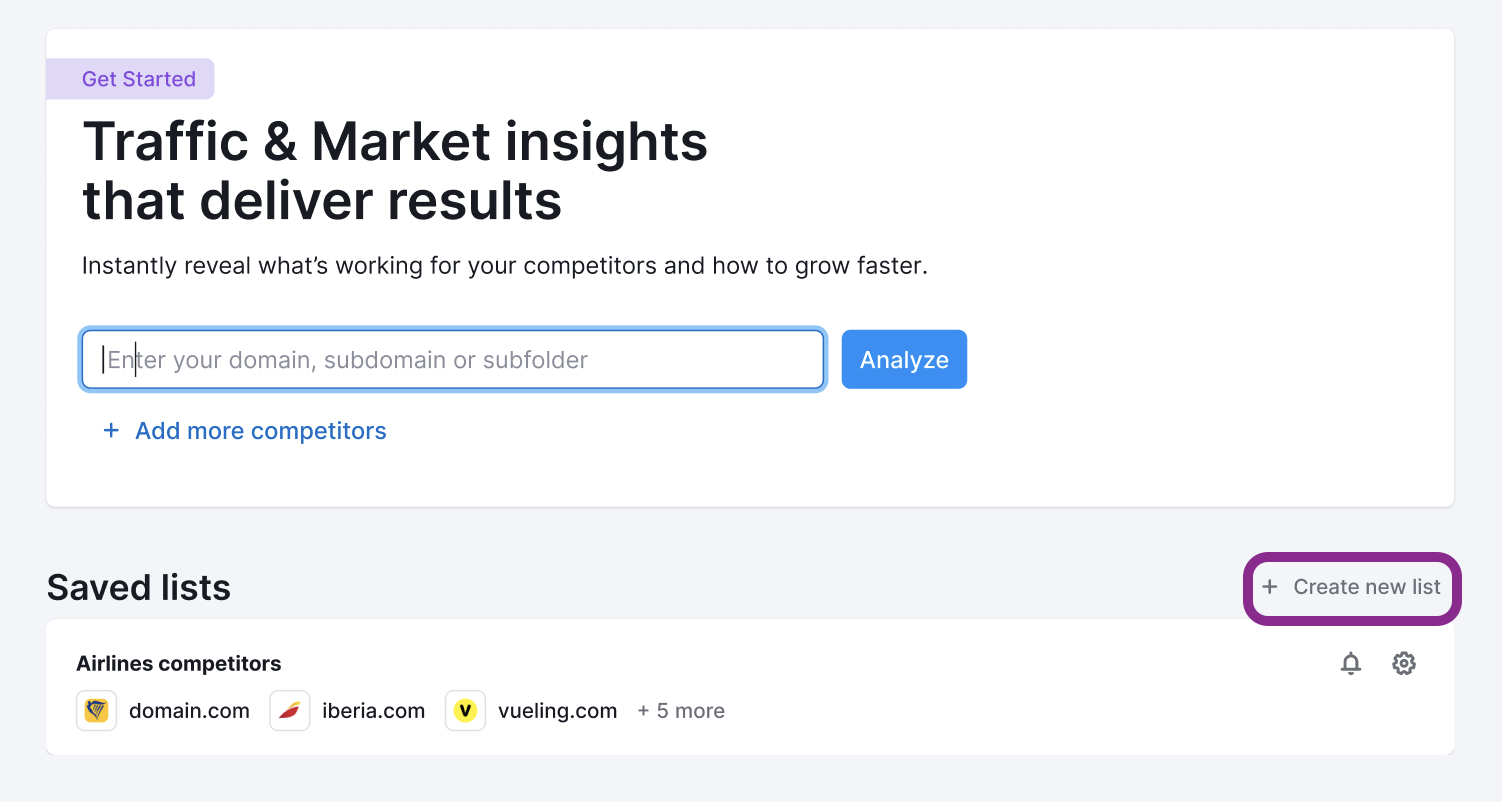
Use the Create List button to start a new project whenever you're analyzing a new domain or market.
Note: At any time inside any dashboard, you can select the Competitor list drop-down in the upper left to edit your current list or create a different one without losing your place.
Step 2: Establish a traffic baseline for your selected domains
Once you’ve entered your domains and created a list, it’s time to start exploring their traffic patterns. This step helps you get a clear picture of:
- How much traffic each domain gets
- How visitors engage with the domains
- What sources and channels drive traffic
- How the traffic trend changes over time
With this information, you can begin to benchmark your own website metrics, identify winning strategies to adopt, and uncover weaknesses you can exploit to gain an edge over your rivals.
Later, this baseline data will also direct you toward other Traffic & Market dashboards that allow you to dive deeper into the data.
Start with the Traffic Analytics dashboard
The Traffic Analytics dashboard gives you a high-level look at each domain’s total visits, engagement metrics, and how traffic is distributed across devices and channels. You’ll also see how traffic trends have shifted month by month, which is useful for identifying long-term growth or decline.

On the right side of the Traffic Trend graph, you’ll find the Traffic Insights panel, which explains why traffic changes occurred.
When a significant anomaly is detected, the Traffic Insights AI analyzes historical data and surfaces the most likely drivers of the change directly in the interface. This helps you move from spotting a spike to understanding its context, without manual analysis.
The Traffic Insights feature currently explains traffic changes based on:
- Seasonality: Whether the spike or drop aligns with historical patterns
- Traffic channel shifts: Changes across Direct, Organic Search, Paid Search, AI Traffic, and more
- Regional specifics: Country- or region-level shifts contributing to the anomaly
- Keyword-level traffic signals: Specific keywords contributing to traffic demand shifts
To ensure clarity and accuracy, the insights provided do not interpret external factors such as news events, product launches, or offline campaigns. All explanations are based solely on observable traffic patterns and internal Traffic & Market data.
You’ll find Traffic Insights:
- Directly on the Traffic Analytics dashboard
- Inside tooltips and popups when hovering over traffic trend graphs
- Included in Traffic Alert emails, so insights reach you even when you’re not in the platform
This makes it easy to quickly determine whether a traffic shift is seasonal, channel-driven, or regional - and decide what to investigate next.
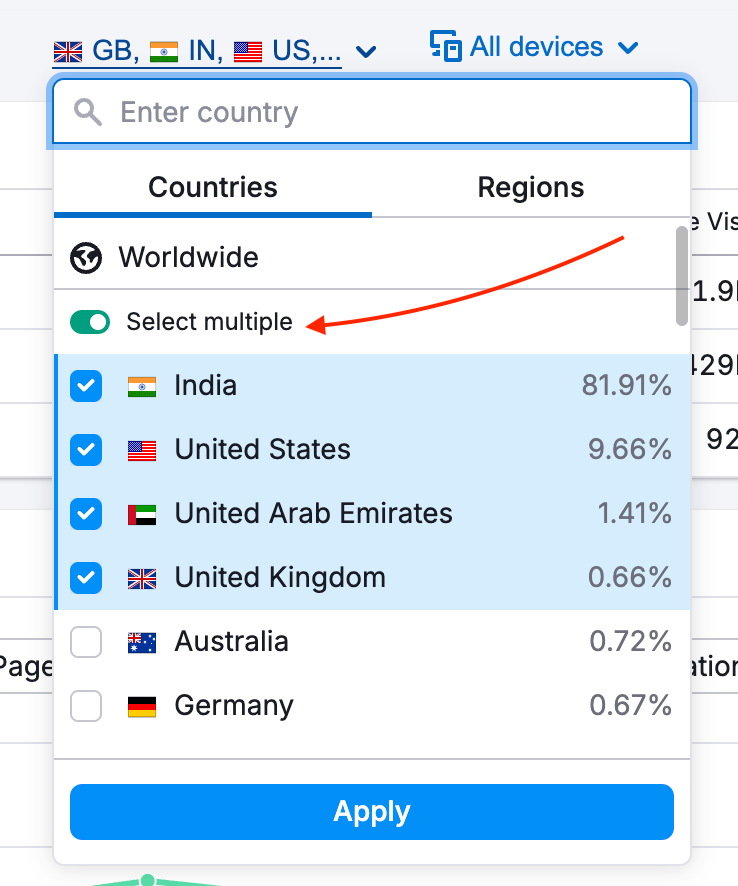
At any time, you can use the dropdowns at the top of any Traffic & Market dashboard to adjust your date range. This helps you tailor the data to your specific timeframe.
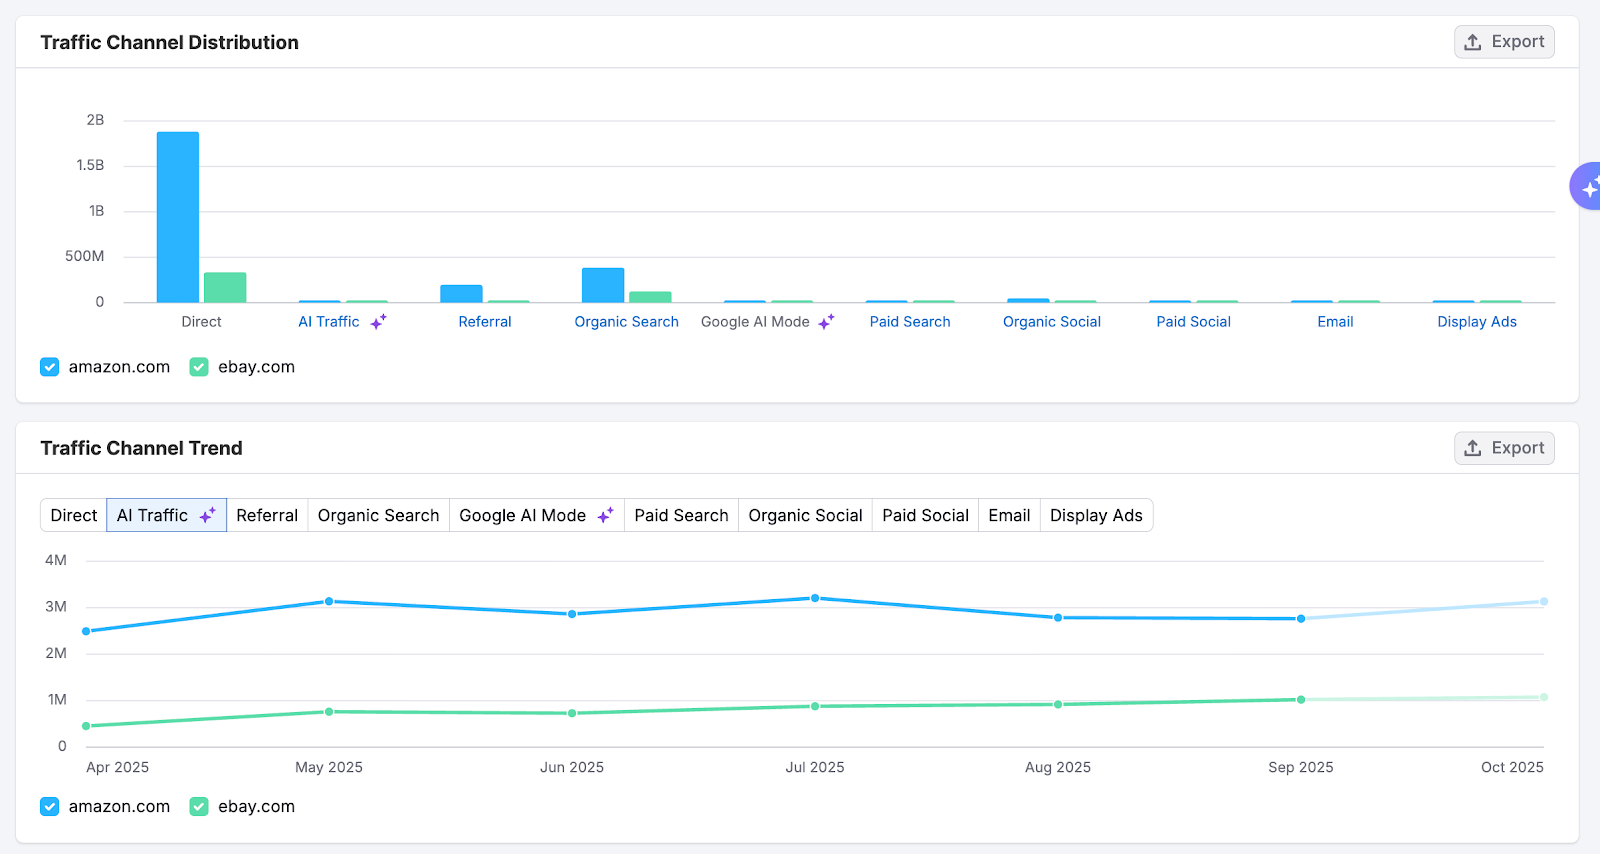
Scroll down for a look at the top traffic channels in the Traffic Channel Distribution and Traffic Channel Trend graphs.
These graphs break down where each domain’s traffic is coming from - whether it's direct visits, search engines, referrals, social media, email, or paid ads - and how that trend has shifted over time.
Use them to spot which channels are strongest, which are underperforming, and how each channel’s traffic is trending over time.
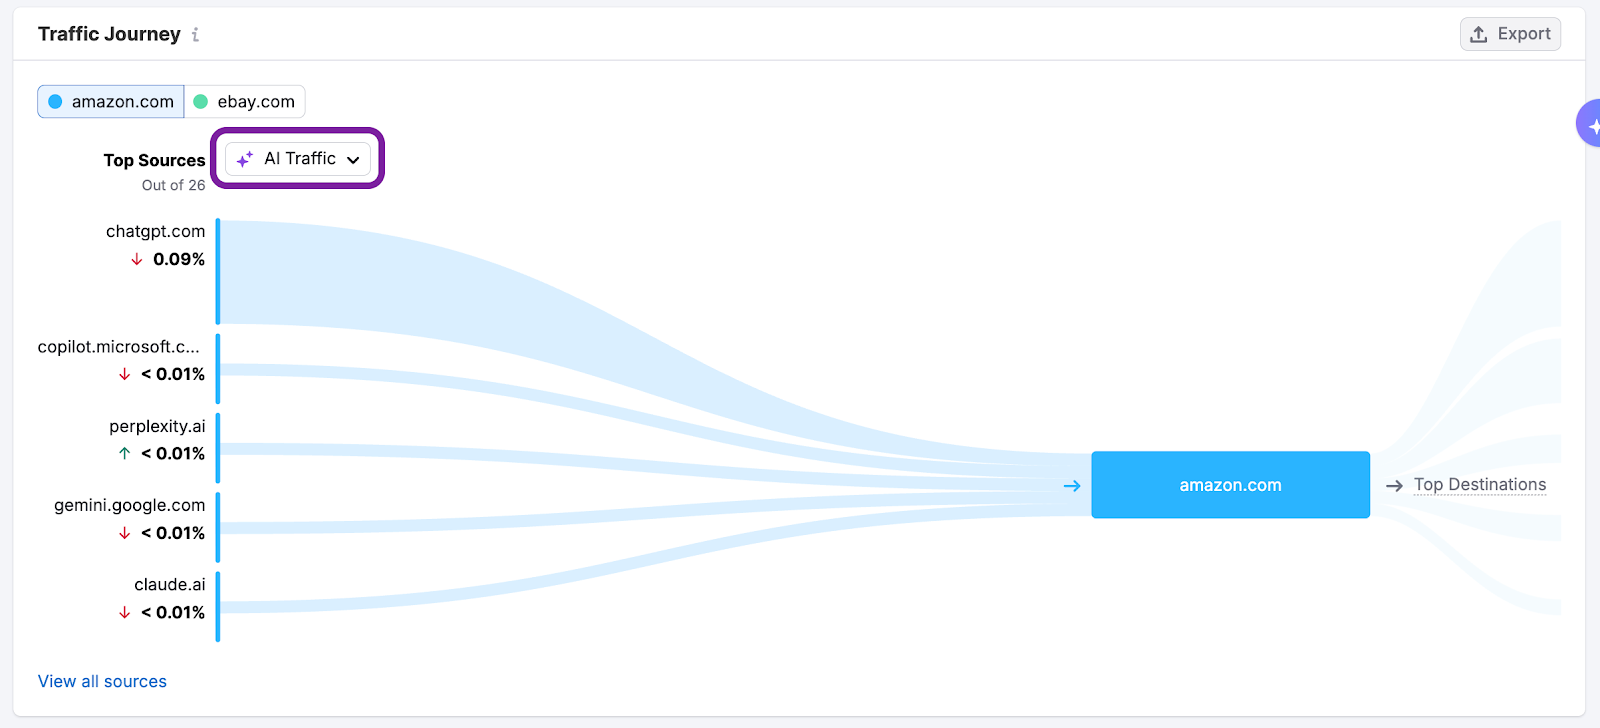
The Traffic Journey chart shows where visitors come from before landing on the domain and where they go after.
Use it to:
- Understand which sites are sending traffic to your competitors’ domains
- See where users navigate next
- Identify potential partnerships, threats, or content gaps
This visual flow helps you grasp not just how users arrive - but how competitor domains fit into their broader online journey. Use the dropdown menu to select the traffic channel you’d like to explore.
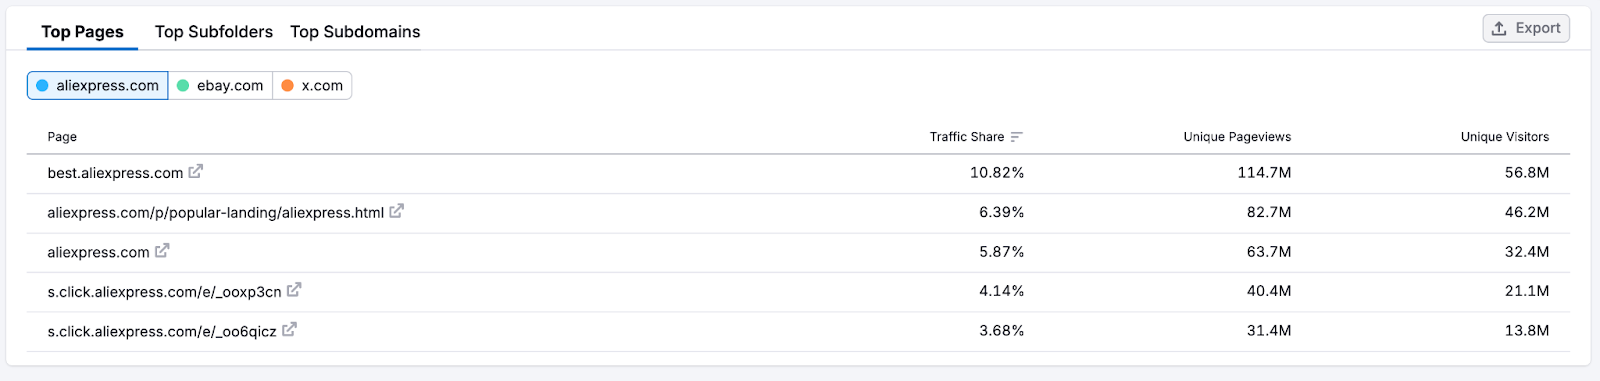
The Top Pages widget provides a quick look at which pages of a competitor's site are driving the most traffic.
Explore channel-specific dashboards
To dive deeper into each source of traffic, move to the channel-specific dashboards. Dashboards for AI traffic, referral, organic search, paid search, organic social, paid social, email, and display ads provide:
- Traffic trends
- Top traffic sources
- Desktop vs. mobile breakdowns
- High-performing pages
- Top keywords (where applicable)
The AI Traffic dashboard gives you visibility into which domains receive traffic from popular AI assistants like ChatGPT, Gemini, Copilot, Perplexity, and others.
Use it to:
- Review traffic source breakdowns and flows, including increases and key traffic metrics
- Compare mobile vs. desktop traffic share
- See side-by-side traffic splits and share comparisons for entered domains

This dashboard helps you understand how AI assistants shape discovery — so you can stay ahead as user behavior continues to evolve. For a full list of AI assistants included in the AI Traffic dashboard, see this article.
Together, these insights give you a clear lens into how each competitor drives overall performance across their site.
Step 3: Understand page-level strategy
To uncover which content is driving traffic for a competitor, go to the Top Pages dashboard. This dashboard offers a detailed view of their most visited URLs, helping you reverse-engineer what’s working and why.
Identify the highest traffic pages and filter by traffic channel
Start by exploring which pages bring in the most traffic, and which pages are new or rising in popularity. Are competitors pushing blog content, product pages, feature rollouts, or something else?

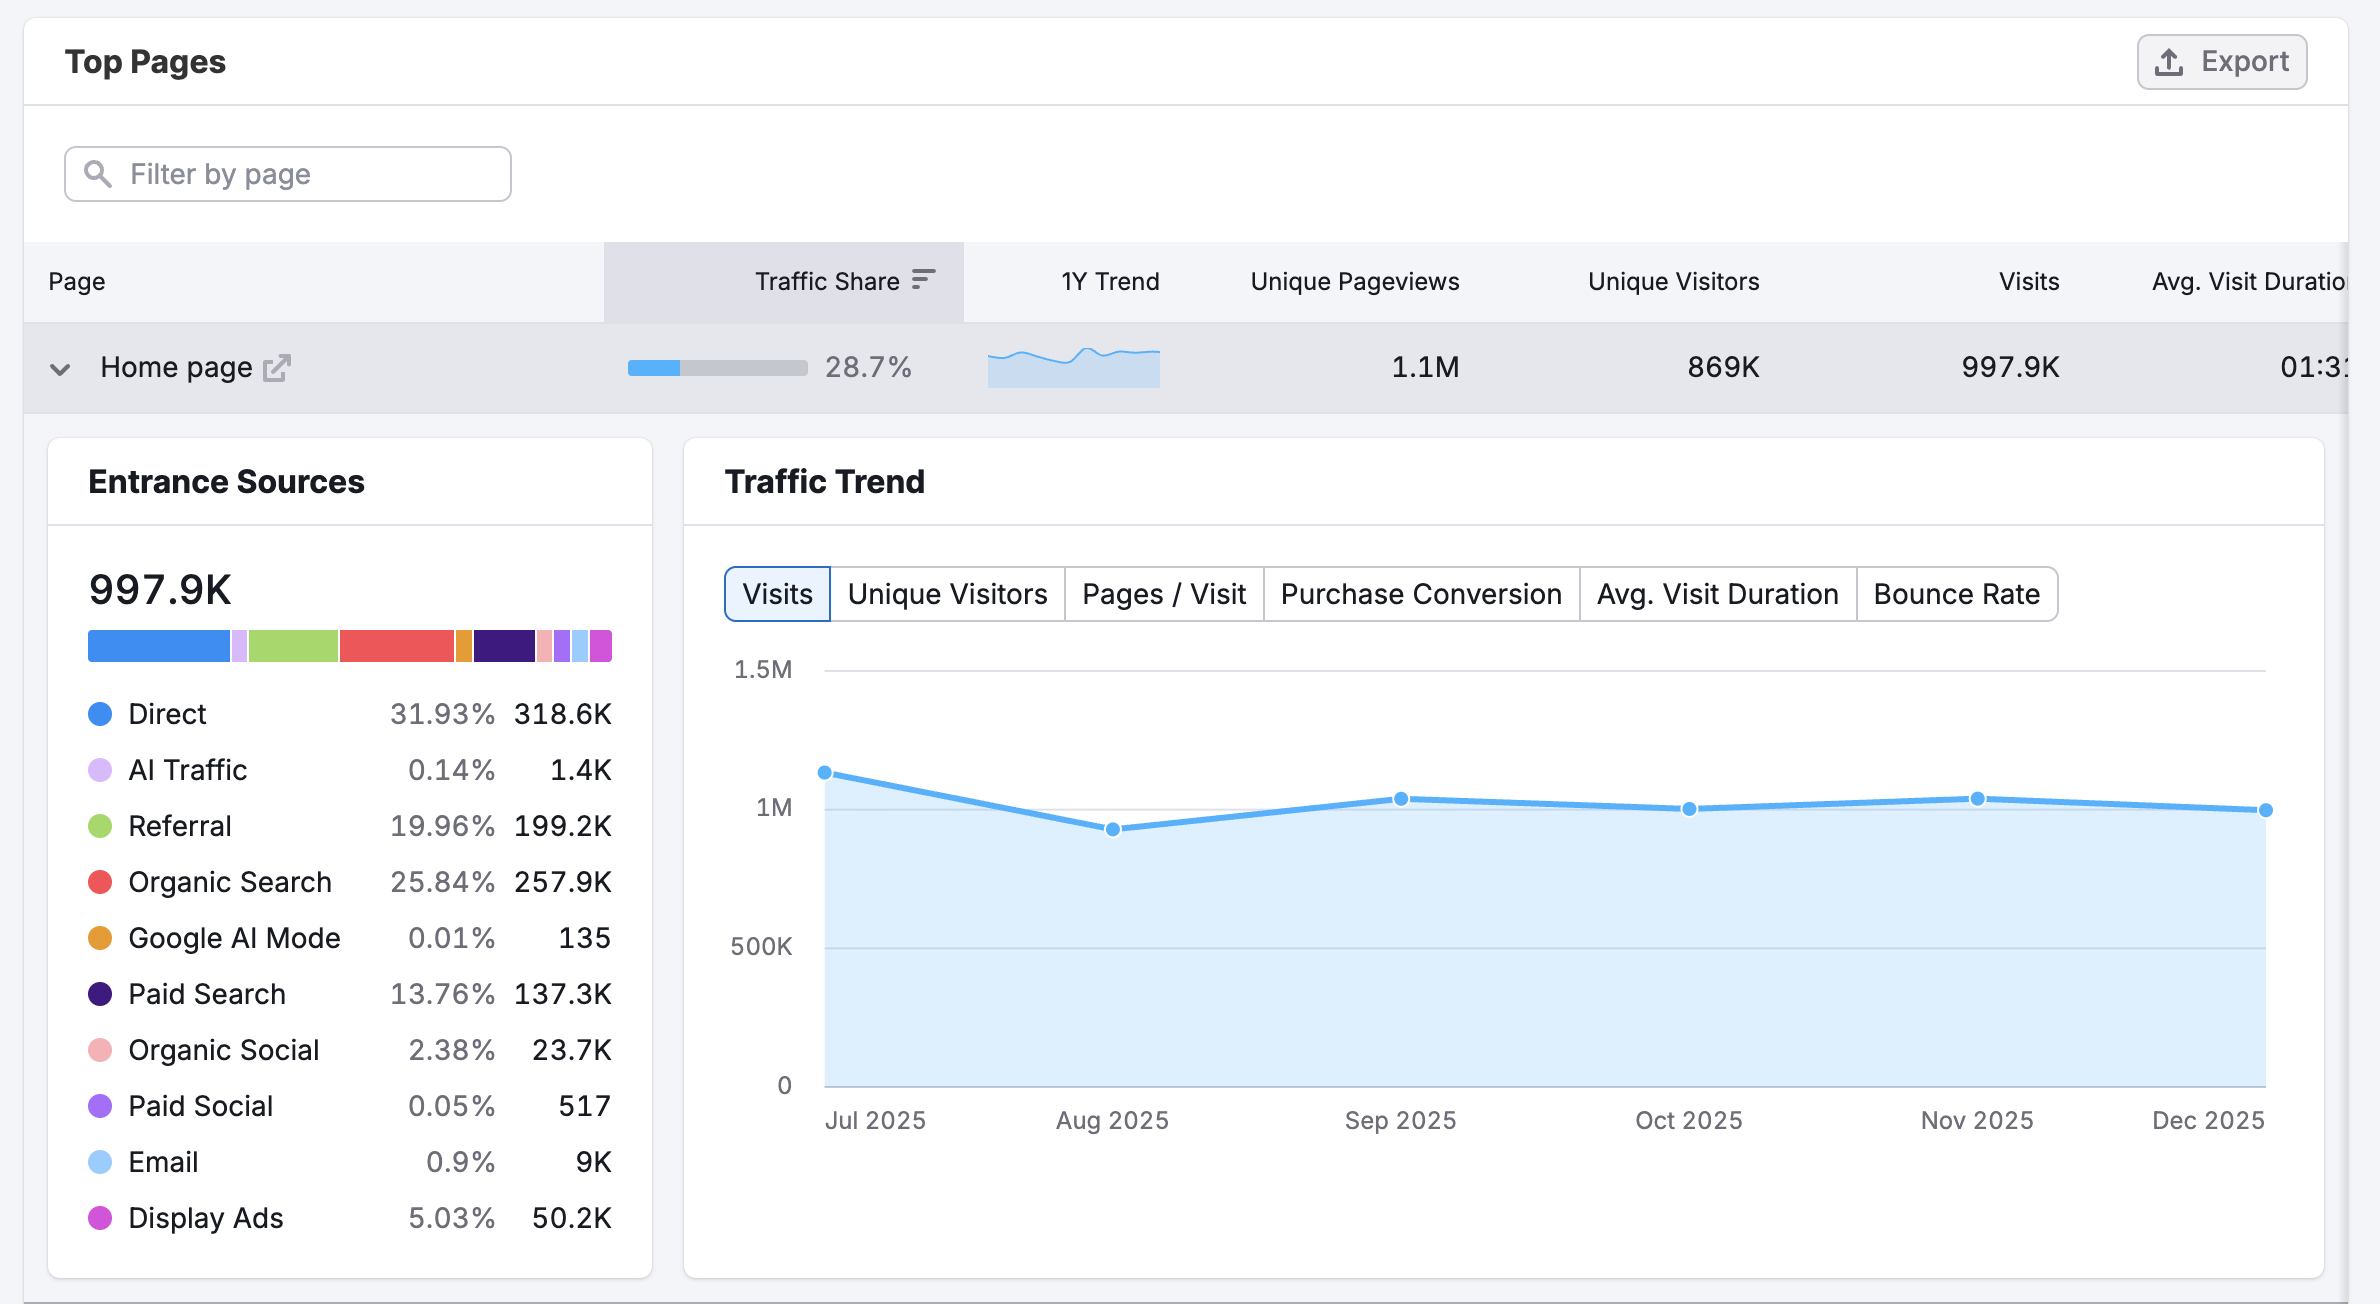
Click on a page entry to view the dropdown, which includes the Entrance Sources table. It breaks down traffic to the page by channel - see whether organic search, paid ads, social, or referrals are doing the heavy lifting. This gives you clues about how they’re promoting key content and where they’re winning visibility.
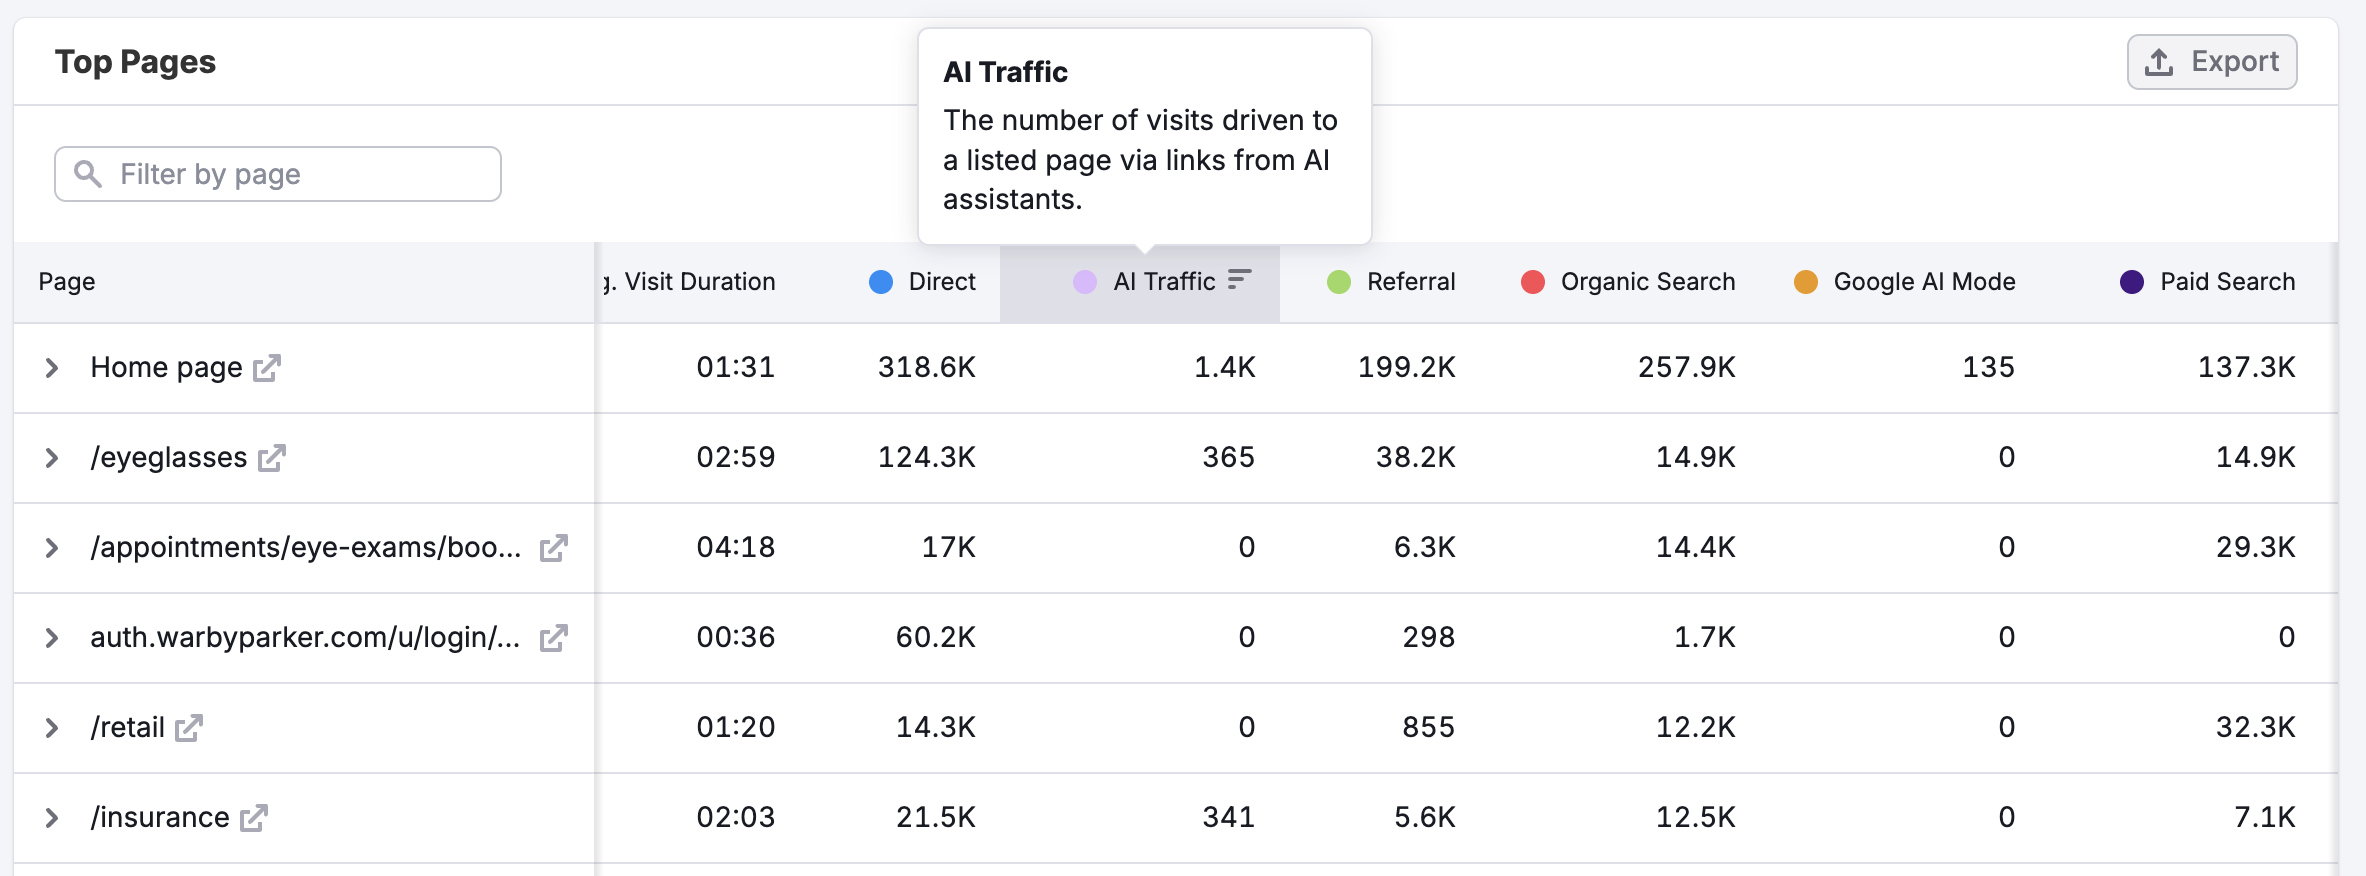
You can also use the Channel Filters at the top of the table to bring top pages in a specific category to the top. This can help you figure out which pages are being promoted in which channels.
Step 4: Evaluate market trends and opportunities
Now that you've analyzed individual competitors' traffic patterns and page-level performance, it's time to zoom out and look at the market as a whole.
The Market Overview dashboard helps you spot emerging trends, benchmark performance at scale, and uncover strategic openings to outpace your rivals.
Understand the overall market size and engagement
At the top of the dashboard, the Market Summary section gives you high-level traffic and engagement data across all competitors in your market view. You’ll see:
- Total Addressable Market (TAM): The estimated size of the full market
- Serviceable Available Market (SAM): The portion of the market your selected competitors are capturing
- Market Share: How traffic is distributed among competitors
- Market Consolidation: How concentrated or fragmented the market is

This section helps you quickly understand the size and structure of the market, how much of it is currently being captured, and how evenly that traffic is distributed. It’s useful for spotting untapped opportunities, evaluating how competitive the space is, and gauging whether you’re operating in a fragmented market or one dominated by a few major players.
Use this data to assess how competitive or saturated the market is - and to benchmark how each competitor stacks up in terms of traffic quality and engagement.
Visualize and pinpoint market positions
The Growth Quadrant plots each domain based on its current market share and traffic growth rate, helping you see how each player stacks up in the competitive landscape.
Domains fall into four key categories:
- Leaders: High market share, high growth
- Established Players: High share, low growth
- Game Changers: Low share, high growth
- Niche Players: Low share, low growth
This layout helps you quickly spot rising stars, dominant players, and stagnant competitors - so you can plan your next move with clarity and confidence.
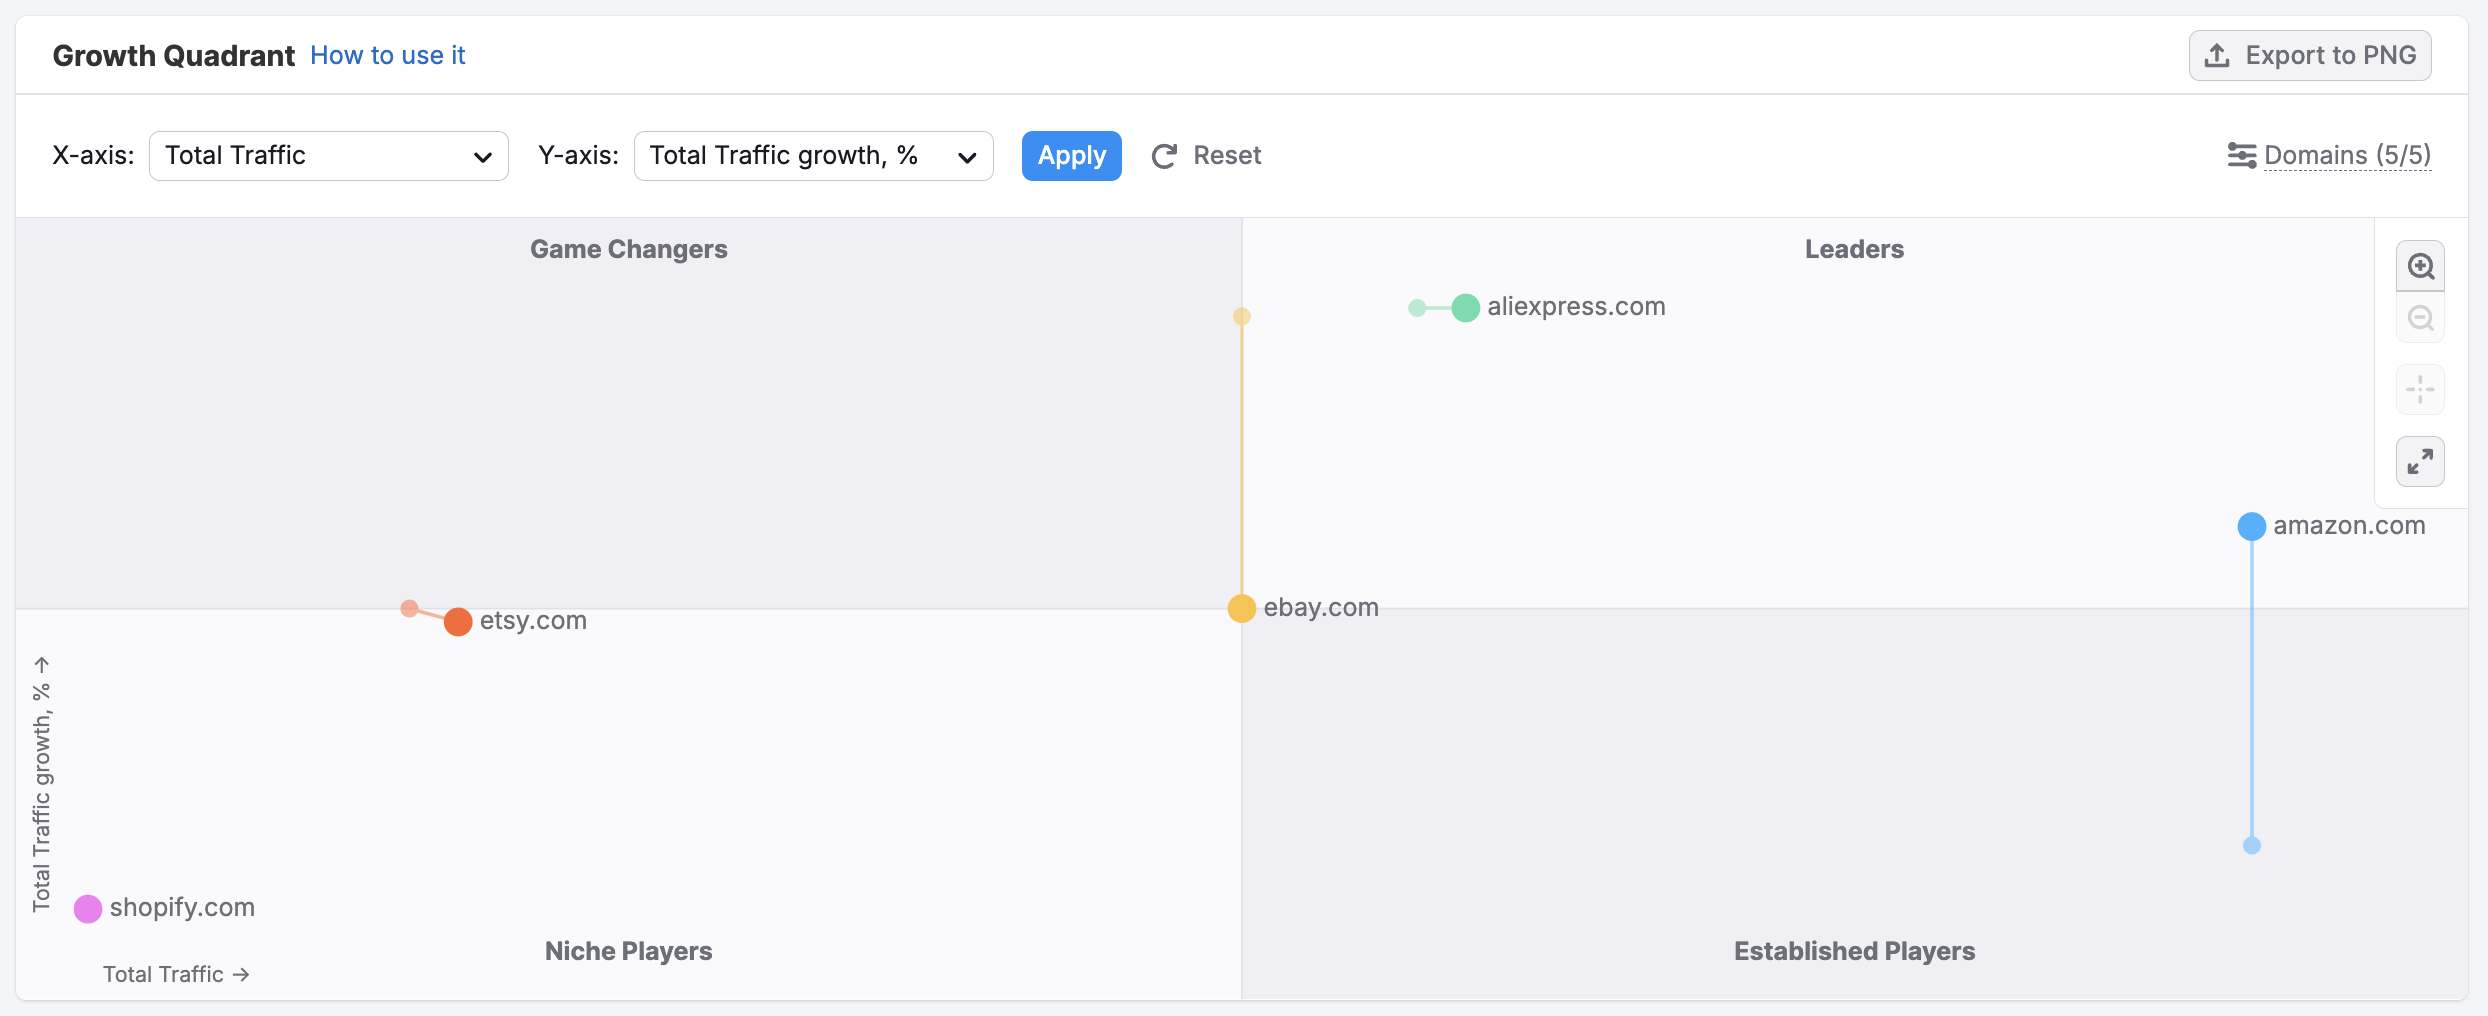
You can customize how the X and Y axes are defined by selecting different traffic channels (e.g., direct, organic, referral) and user engagement metrics (e.g., visit duration, bounce rate). This lets you surface more targeted insights based on the KPIs that matter most to your strategy.
Compare traffic and engagement across all domains
At the bottom of the dashboard, the Market Players table provides a sortable list of all tracked domains.
For each one, you’ll get:
- Traffic volume and market share
- Traffic trend over time
- Engagement metrics like pages per visit and duration

Use this to pinpoint leaders in your space, track shifting dynamics, and identify under-the-radar competitors gaining ground.
Step 5: Monitor competitor moves with Competitor Monitoring
Once you’ve analyzed the data, staying alert to what competitors are doing next is just as important. Competitor Monitoring helps you monitor their latest moves, so you’re never caught off guard.
Use the Competitor Monitoring dashboard to:
- Track new content and pages added to competitor sites
- Get alerts on changes in competitor activities and trends
- Stay informed about product launches, promo updates, or campaign shifts

You can set up automated alerts in Competitor Monitoring to receive email or Slack notifications whenever a tracked competitor makes a change, so you never miss a move. It’s a simple way to keep your finger on the pulse, ensuring you’re never caught off guard by a competitor’s next move.
Step 6: Get instant updates with Traffic Alerts
While Competitor Monitoring helps you stay informed with weekly summaries of competitor activity, Traffic Alerts give you real-time visibility into sudden traffic shifts, so you can act the moment changes happen.
Traffic Alerts automatically notify you whenever tracked domains experience a significant spike or drop in visits.
To help you make sense of these trends immediately, each alert includes specific context behind the change:
- Affected Domain and Country: Identify exactly where the shift is occurring
- Size and Recency: See the magnitude of the change and how recently it occurred
- Traffic Channel: Understand which specific channel (e.g., Organic Search, Direct, or Paid) is responsible for the fluctuation
- Possible Drivers: Receive automated insights into whether a trend is isolated, related to seasonality, or tied to specific shifts in traffic distribution
AI-powered Traffic Insights are also included in Traffic Alerts, explaining spikes or drops based on seasonality, channels, and regions.
Use Traffic Alerts and AI Traffic Insights to:
- Catch changes as they happen — no need to wait for weekly updates
- Spot competitive surges or slowdowns immediately
- Stay proactive with concise, automated insights delivered straight to your inbox or Slack
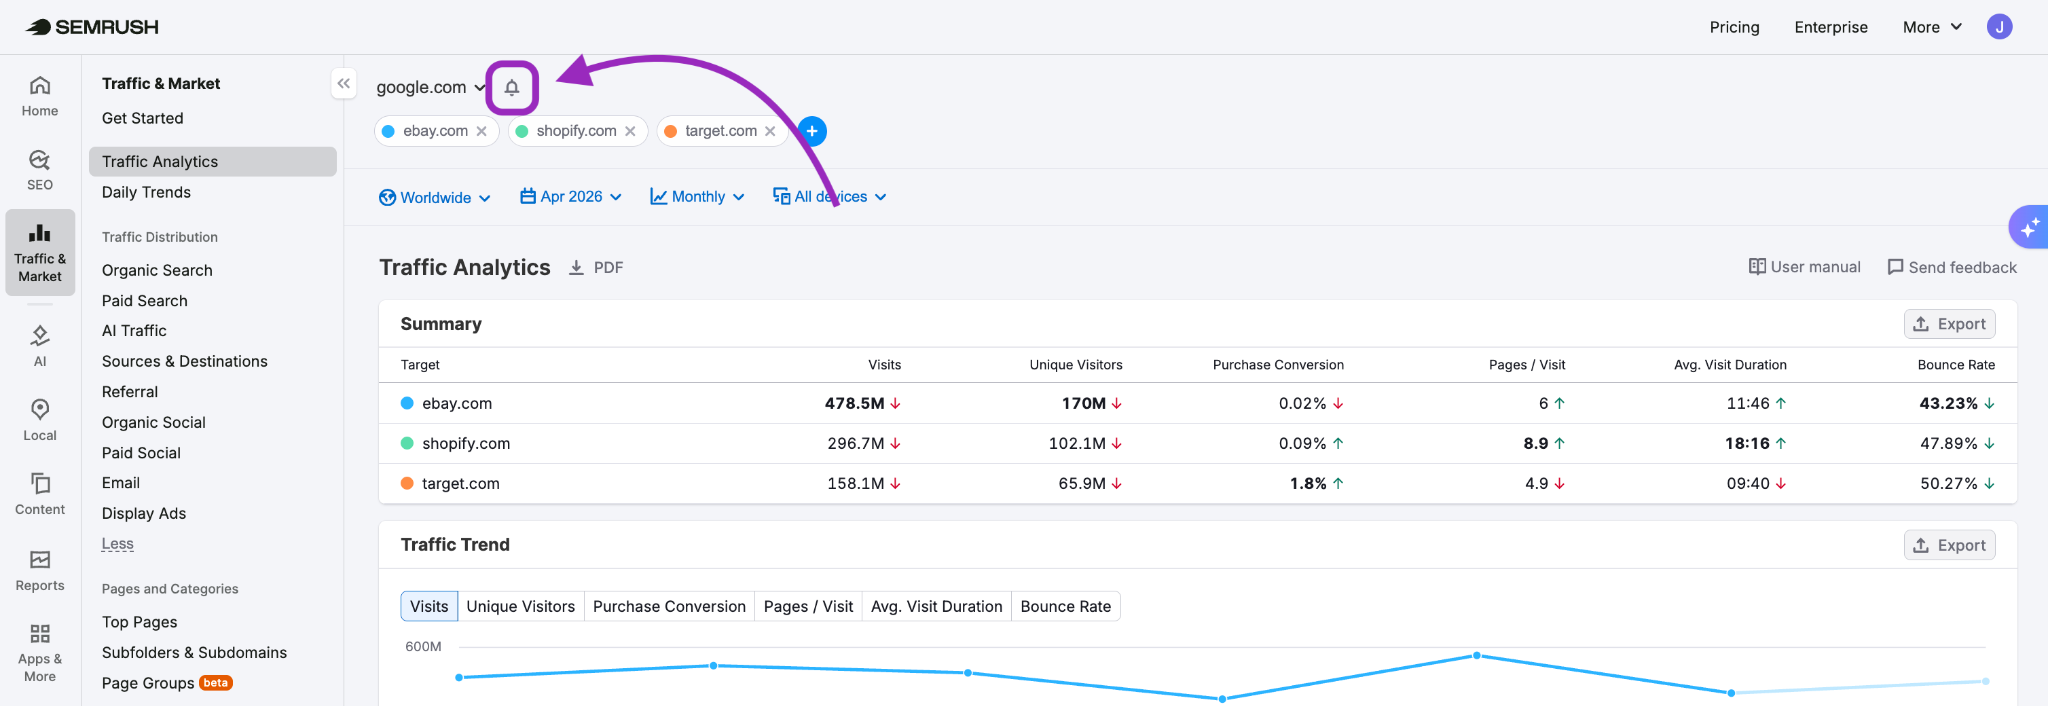
To enable alerts, open the list settings by clicking the bell icon next to your list, then go to the Notifications tab. Toggle the Traffic shifts switch on to receive immediate updates. You can also check the corresponding boxes under Traffic updates to receive regular monthly or weekly competitor overviews.

Note: Alerts must be activated individually for each list you have saved in the toolkit.

You’ll start receiving automatic updates anytime a major shift occurs - keeping you informed between Competitor Monitoring reports and ensuring you never miss a move.
A complete view in just a few steps
With this process, you can get a full picture of any domain's traffic performance, content strategy, and market position. The Traffic & Market Toolkit brings all the insights together, so you can move from raw data to smarter strategy, faster.